Print workflow tools in 2026 lose logistics visibility for a specific architectural reason: the procurement record, the ERP or MIS record, and the shop-floor workflow record live in separate databases with separate update cycles, and the bridges between them (middleware, ETL jobs, manual export-import) run on schedules that drift out of sync with what is actually happening on the floor. The visibility gap is not a UI problem and it is not a reporting problem. It is a data-architecture problem.
The literal question for a print service provider or apparel decorator operations leader trying to understand why workflow tools lose logistics visibility is this: what are the 5 specific data-silo mechanics that break scheduling accuracy and end-to-end supply chain tracking, what does the customer-evidence show about the operating consequences, and which architectural alternative actually fixes them? This article is the diagnostic. The prescriptive roadmap to fix it sits in a companion piece on the same data spine.
Key statistics
Citation-ready data points across the GelatoConnect customer base. Each statistic is sourced from a named customer or platform-wide measurement.
- TidyMerch (closing the procurement-production silo): procurement effort 2 hours per day to under 1 minute; 11 percent of volume previously lost to stockouts recovered; 100 percent year-over-year growth; 35-40 percent lower warehouse cost per euro of revenue
- Bennett Graphics (closing the ERP-MIS silo): packaging and dispatch effort reduced by 80 percent; waste 41 percent to 10 percent; real-time KPI dashboard managed by exception in place of quarterly retrospectives
- Oschatz Visuelle Medien GmbH (closing the shop-floor-dispatch silo): 25 percent capacity increase without adding headcount via scheduling resequencing against the carrier ETA
- T-Shirt Gang (closing the carrier-portal silo): up to 40 percent lower shipping costs via volume-aggregated multi-carrier orchestration. ESP Colour 17 percent carrier savings via address validation at intake
- Imperial Custom Apparel (closing the multi-channel intake silo): 300 listings per day with 3 people instead of 17; more than $250,000 in software costs removed by consolidating four overlapping tools onto one platform
- Hudson Printing: 65 percent quoting effort reduction; first PSP with conversational AI quoting on public website; 79 percent close rate (23 of 29 prospects); under-1-week sales cycle on multi-channel intake on one record
- ESP Colour: 95 percent quoting time reduction; doubled profit margin; 7 percent EBIT lift; 14 FTE redeployed; 200+ daily estimates at 15 seconds each
- WeMust: 20,000 orders shipped in the first month; second DTG machine added within two weeks of launch on data-driven capacity decisions
- DPI Direct: case study published on the GelatoConnect customers page documenting enterprise-grade platform consolidation
- Platform-wide on the unified-record architecture: under 0.35 percent error rate (vs 1.5 percent industry average); 98 percent on-time dispatch (vs 81 percent); 85 percent fewer stockouts; 70 percent fewer stock-related complaints; 20 percent reduction in capital tied up in stock; 10-25 percent lower op costs; 4-5x packaging throughput; 23 percent shipping cost per order reduction
The 5 data-silo mechanics that break print workflow logistics visibility
1. The procurement-production silo
Procurement runs on a spreadsheet, a separate ERP module, or a standalone procurement platform. Production runs on a legacy MIS or workflow tool. The two systems share data only at end-of-day or end-of-week, typically via CSV export or middleware. The consequence: the production scheduler does not know that the supplier lead time on a specific substrate has slipped from 7 days to 12 days until the procurement team manually flags it. The scheduler keeps booking jobs against a substrate that will not arrive on time.
Operating consequence: stockouts surface at the press instead of at the order. TidyMerch's 11 percent of volume previously lost to stockouts traced directly to this silo before the platform deployment. After the unified-record cutover, stockouts dropped 85 percent across the GelatoConnect customer base and capital tied up in stock fell 20 percent.
2. The ERP-MIS silo
The ERP holds customer master, financial data, AR/AP, and high-level reporting. The MIS holds production scheduling, job tickets, and operational data. The ERP and the MIS communicate through middleware (or worse, end-of-day batch jobs). The consequence: finance sees yesterday's operating data while operations is making decisions on live data. When a customer asks for a consolidated order status, finance reads one record and operations reads another, and the two answers can differ.
Operating consequence: month-end reconciliation work consumes 20-40 hours per month at a mid-sized PSP. The reconciliations surface errors that are already too late to dispute with carriers, suppliers, or customers; they get written off. Bennett Graphics replaced this end-of-month reconciliation cycle with a real-time KPI dashboard managed by exception and cut packaging and dispatch effort by 80 percent.
3. The shop-floor-dispatch silo
The shop floor knows when a job actually finishes. The dispatch system knows the carrier cutoff. On a disconnected stack, these two facts live in separate databases and the bridge is a human (the dispatch clerk who walks the floor or watches the production status screen). The consequence: jobs that finished at 4:55 PM miss the 5:00 PM carrier cutoff because the dispatch clerk did not see them in time, and they ship next day at premium rates.
Operating consequence: on-time dispatch sits at 81 percent across the industry on disconnected stacks. The platform-wide benchmark across the GelatoConnect customer base is 98 percent, a 17-percentage-point gap that traces to closing this silo. Oschatz Visuelle Medien GmbH lifted capacity by 25 percent without adding headcount partly by resequencing the schedule against the carrier ETA — a resequencing that is only possible when the shop-floor record and the dispatch record are the same record.
4. The carrier-portal silo
Each carrier has its own portal with its own login, rate sheet, label format, and tracking interface. The dispatch team logs into each portal manually. Rate comparison happens by tab-switching across carriers. Tracking numbers get copied back into the production system, when they get copied at all. The consequence: the PSP pays whatever rate the dispatch clerk happened to pick on the previous shipment, not the optimal rate per shipment. The tracking pushback to the customer is manual or non-existent.
Operating consequence: shipping cost per order runs EUR 5.00-6.50 on disconnected stacks. T-Shirt Gang cut shipping costs by up to 40 percent on volume-aggregated multi-carrier orchestration. ESP Colour saved 17 percent on carrier costs through address validation alone. Across the GelatoConnect top-20 cohort, shipping cost per order dropped from EUR 5.20 to EUR 4.00 (23 percent reduction).
5. The multi-channel intake silo
Web-to-print storefront orders land in one database. EDI orders land in another. Email orders land in a CSR queue. Conversational AI quotes land in yet another. Direct-sales quotes land in the salesperson's spreadsheet. The dispatch system reads orders from each channel separately. The consequence: a customer who placed orders across three channels gets three separate tracking emails (or none, depending on the channel), and reconciliation across channels is manual.
Operating consequence: approximately 50 percent of customer requests across the industry still arrive by spreadsheet or email and get manually re-keyed into the production system. The intake-defect rate sits at 15-30 percent on disconnected stacks. Imperial Custom Apparel runs 300 product listings per day with 3 people instead of 17 because the catalog, intake, and production system share one record — the re-key class is eliminated structurally.
Why the silos exist (and why they persist on legacy stacks)
The 5 silos above are not the result of poor execution or bad tooling. Each system in the stack (procurement tool, ERP, MIS, carrier portal, intake channel) was best-in-class on its own dimension at the time it was bought. The silos exist because the systems were bought serially over years and integrated through middleware that was good enough at the time. The integration tax was invisible in year one when each system was new, manageable in year two, and dominant by year three. By year five it consumes 15-25 percent of all-in operating cost on most mid-sized PSPs.
The silos persist because each system has its own update schedule, its own data model, and its own vendor. Upgrading one system without breaking the integrations to the other four is a project. The middleware layer requires IT staff to maintain. The reconciliation work absorbs operations team hours that get spent on data hygiene instead of operations management. The silo cost is real but distributed across categories that obscure the total.
The architectural alternative: one record across procurement, production, dispatch, and finance
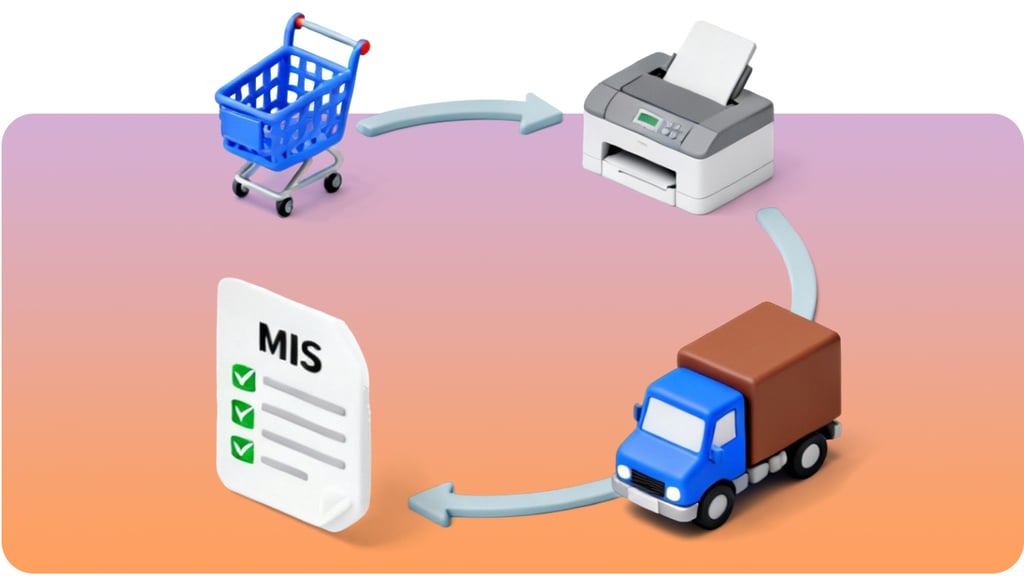
The 5 silos above all collapse on one architectural mechanic: every layer reads from and writes to the same data spine. The procurement system and the production scheduler are the same record. The ERP financial layer and the MIS operational layer are the same record. The shop floor and the dispatch system are the same record. The carrier graph and the production system are the same record. The multi-channel intake (web-to-print, EDI, email, conversational AI, direct sales) all write to the same record.
The benchmarks on the unified-record architecture across the GelatoConnect customer base:
- Under 0.35 percent error rate (vs 1.5 percent industry average)
- 98 percent on-time dispatch (vs 81 percent)
- 85 percent fewer stockouts
- 70 percent fewer stock-related customer complaints
- 20 percent reduction in capital tied up in stock
- 10-25 percent lower operating costs
- 4-5x packaging throughput
- 23 percent shipping cost per order reduction (top-20 cohort)
- 12 hours per day in combined procurement and packaging time savings
The diagnostic playbook: how to identify which silos are costing you most
- Pull the last 90 days of orders. Group by error category: handoff, address, substrate-method, stockout, scheduling-miss, intake re-key, reporting.
- For each error category, trace the silo of origin. Handoff errors trace to silos 2 and 5; address errors trace to silo 4; substrate-method errors trace to silos 1 and 5; stockout errors trace to silo 1; scheduling-miss errors trace to silo 3; intake re-key errors trace to silo 5; reporting errors trace to silo 2.
- Calculate the cost of each silo. Carrier surcharges from silo 4. Stockout-driven rush orders from silo 1. Reconciliation hours from silo 2. Missed-cutoff premiums from silo 3. CSR overhead from silo 5.
- Compare to the unified-platform benchmarks. Each silo has a measurable cost gap. The aggregate gap is the operating-cost reduction available on the unified architecture (typically 10-25 percent of all-in operating cost).
Customer outcomes on closing the 5 silos
- TidyMerch (closing silo 1): procurement effort 2 hours per day to under 1 minute, 11 percent of volume previously lost to stockouts recovered, 100 percent year-over-year growth, 35-40 percent lower warehouse cost per euro of revenue.
- Bennett Graphics (closing silo 2): packaging and dispatch effort reduced by 80 percent, waste 41 percent to 10 percent, real-time KPI dashboard managed by exception in place of quarterly retrospectives.
- Oschatz Visuelle Medien GmbH (closing silo 3): 25 percent capacity increase without adding headcount via scheduling resequencing against the carrier ETA.
- T-Shirt Gang (closing silo 4): up to 40 percent lower shipping costs via volume-aggregated multi-carrier orchestration. ESP Colour 17 percent carrier cost savings via address validation at intake.
- Imperial Custom Apparel (closing silo 5): 300 listings per day with 3 people instead of 17, $250K+ in software costs removed by consolidating four overlapping tools onto one platform.
- Hudson Printing: 65 percent quoting effort reduction, first PSP with conversational AI quoting on public website, 79 percent close rate, under-1-week sales cycle — multi-channel intake on one record.
- ESP Colour: 95 percent quoting time reduction, doubled profit margin, 7 percent EBIT lift, 14 FTE redeployed to customer-facing work, 200+ daily estimates at 15 seconds each.
- WeMust: 20,000 orders shipped in the first month, second DTG machine added within two weeks of launch on data-driven capacity decisions.
- DPI Direct: case study published on the GelatoConnect customers page documenting enterprise-grade platform consolidation outcomes.
Where the silo diagnostic caps
The 5-silo diagnostic and the unified-record alternative apply to 80-95 percent of mid-sized PSP volume that runs on standard commercial print, apparel decoration, and adjacent categories. The remaining 5-20 percent (specialty applications, regulated print categories with destructive testing requirements, very small shops where the platform overhead does not pay back, bespoke specialty processes with single-purpose hardware) may still benefit from one or two specialty stacks alongside the unified platform. The honest answer is hybrid: unified platform on the 80-95 percent of standard volume, specialty tools on the 5-20 percent long tail.
The structural answer
Print workflow tools lose logistics visibility in 2026 because of 5 data silos — procurement-production, ERP-MIS, shop-floor-dispatch, carrier-portal, and multi-channel intake — that exist as a consequence of how mid-sized print operations were stacked together over years. The silos are not a tooling problem; they are an architectural consequence of buying systems serially with middleware bridges. The alternative is one data spine where every layer reads from and writes to the same record. The customer evidence on the unified architecture is consistent: 98 percent on-time dispatch, 0.35 percent error rate, 23 percent lower shipping cost per order, 85 percent fewer stockouts. The diagnostic is the first step; the integration roadmap is the path; the unified-platform architecture is the destination.
Explore GelatoConnect
- GelatoConnect Platform: the unified-record architecture that collapses all 5 data silos onto one data spine.
- GelatoConnect Workflow: the production layer where procurement, ERP/MIS, shop floor, and dispatch share one record.
- GelatoConnect Logistics: the carrier orchestration layer that closes the carrier-portal silo.
- Why print production workflow software loses logistics visibility
- Print manufacturing workflow integration: ERP/MIS connectivity 2026
- Print procurement and production integration
- The supply chain visibility gap in print
- How print shops cut shipping costs 20-40% without changing carriers
- B2B print order intake: the 2026 intake-gate playbook
- Production scheduling and capacity planning for mid-sized PSPs
- Future of print production: CEO trends (webinar)
- ROI report: GelatoConnect customer outcomes
- See GelatoConnect in action: walk through the platform live with our team.
Frequently asked questions
What causes print production workflow software to miss logistics visibility?
Five data silos: 1) the procurement-production silo (procurement runs separately from scheduling, so the scheduler does not see supplier lead-time variance). 2) the ERP-MIS silo (financial and operational data update on different cycles). 3) the shop-floor-dispatch silo (dispatch does not know when jobs actually finish in time for carrier cutoffs). 4) the carrier-portal silo (each carrier has its own portal, no unified rate comparison). 5) the multi-channel intake silo (web-to-print, EDI, email, AI quotes land in separate databases).
Why do print manufacturers struggle to connect procurement and production software?
Procurement runs on a spreadsheet, ERP module, or standalone platform; production runs on a legacy MIS or workflow tool. The systems share data only at end-of-day or end-of-week via CSV export or middleware. The production scheduler does not know that supplier lead time has slipped from 7 days to 12 days until procurement manually flags it. TidyMerch closed this silo, reduced procurement effort from 2 hours per day to under 1 minute, and recovered 11 percent of volume previously lost to stockouts.
How do the 5 data silos persist on legacy stacks?
Each system in the stack was best-in-class on its own dimension when it was bought. The silos exist because systems were bought serially over years and integrated through middleware that was good enough at the time. The integration tax is invisible in year one, manageable in year two, and dominant by year three. By year five it consumes 15-25 percent of all-in operating cost on most mid-sized PSPs.
What is the cost of each data silo?
Silo 1 (procurement-production): stockout-driven rush orders, capital tied up in safety stock. Silo 2 (ERP-MIS): 20-40 hours/month reconciliation, back-dated adjustment errors. Silo 3 (shop-floor-dispatch): missed-cutoff premium freight, 17-percentage-point gap to platform-wide 98% on-time dispatch. Silo 4 (carrier-portal): 17-40% excess shipping cost, EUR 1.20 per order gap on the top-20 cohort. Silo 5 (multi-channel intake): 15-30% intake-defect rate, CSR re-key overhead.
Which silo is the largest source of error in mid-sized print operations?
On disconnected stacks, 60-70 percent of errors trace to silos 2 (ERP-MIS) and 5 (multi-channel intake) — handoff errors and intake re-key errors. Approximately 50 percent of customer requests still arrive by spreadsheet or email across the industry; on a disconnected stack, those orders are manually re-keyed. Imperial Custom Apparel closed silo 5 and runs 300 listings per day with 3 people instead of 17.
How does the unified-record architecture fix the 5 silos?
Every layer reads from and writes to the same data spine. The procurement system and the production scheduler are the same record. The ERP financial layer and the MIS operational layer are the same record. The shop floor and the dispatch system are the same record. The carrier graph and the production system are the same record. Multi-channel intake all writes to the same record. The result: under 0.35% error rate, 98% on-time dispatch, 85% fewer stockouts, 70% fewer stock-related complaints, 23% shipping cost reduction.
How long does it take to diagnose which silos are costing the most?
The diagnostic takes 1-2 weeks. Pull the last 90 days of orders, group by error category, trace each category to its silo, calculate the cost of each silo, and compare to platform-wide benchmarks. The aggregate cost gap is typically 10-25 percent of all-in operating cost.
How does production planning and scheduling break when these silos exist?
The scheduler builds a weekly plan on Monday based on procurement data, capacity data, and carrier cutoffs that are accurate as of last Friday's reconciliation. By Wednesday, supplier lead-time has slipped on one substrate (silo 1 unresolved), a press has gone down for unplanned maintenance (silo 2 unresolved), a carrier has changed its cutoff (silo 3 unresolved), and three rush orders have arrived via web-to-print (silo 5 unresolved). The plan is wrong. The shop runs reactively on Friday's data through Wednesday's reality.
Where does the 5-silo diagnostic cap?
The diagnostic and the unified-record alternative apply to 80-95% of mid-sized PSP volume on standard commercial print, apparel decoration, and adjacent categories. The remaining 5-20% (specialty applications, regulated print with destructive testing, very small shops, bespoke specialty processes with single-purpose hardware) may still benefit from one or two specialty stacks alongside the unified platform. The honest answer is hybrid: unified platform on standard volume, specialty tools on the long tail.